
The Fed, a historic ETF outflow streak, and a Middle East flare-up have combined to trap Bitcoin in one of its tightest, most nervous ranges in years.
Published July 13, 2026
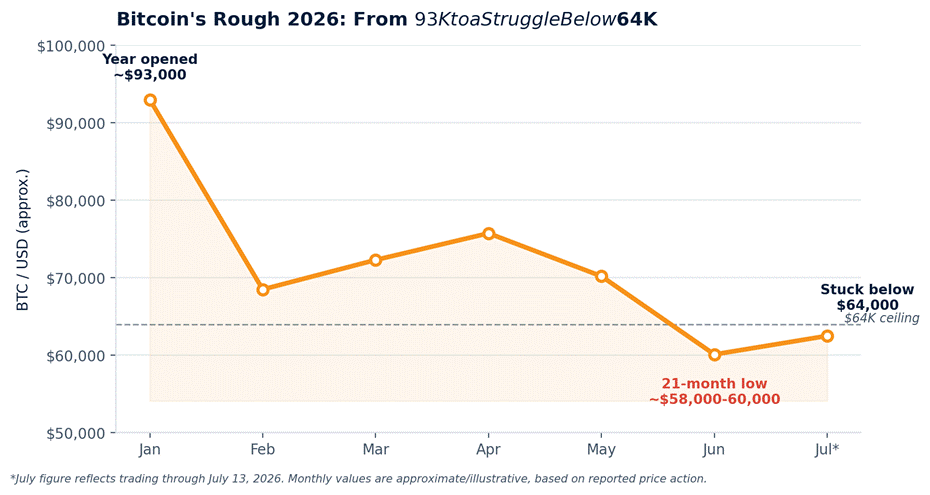
Bitcoin opened 2026 above $93,000 and has spent the summer fighting to reclaim $64,000.
Six months ago, Bitcoin bulls were dreaming about six figures. Today, they’re just hoping $64,000 holds as resistance rather than becoming a distant memory. As of mid-July 2026, BTC is stuck grinding between roughly $60,000 and $64,000 — a level that has rejected every serious rally attempt since late June.
So what actually happened? It’s not one villain — it’s four forces pulling in the same direction at once: a hawkish new Fed chair, an unprecedented wave of ETF redemptions, fresh geopolitical shocks, and a technical chart that just broke a multi-year trendline. Here’s the full picture, with the numbers behind it.
“Bitcoin enters July oversold, deleveraged, and quietly accumulated — but pinned beneath falling resistance by a Fed that has taken rate cuts off the table.”
The Snapshot: Bitcoin at a Glance (July 13, 2026)
| Metric | Level / Figure |
| Current price (approx.) | $60,000 – $64,000 |
| 2026 year-open price | ~$93,000 |
| 21-month low (late June) | ~$58,000 – $60,000 |
| Key resistance zone | $63,800 – $65,700 |
| Key support floor | ~$58,000 |
| 200-week moving average | First weekly close below since 2023 |
| Next Fed decision | July 28–29, 2026 |
| Next inflation print (CPI) | July 14, 2026 |
Figures are approximate and reflect reported price action and technical levels as of July 13, 2026.
1. The Fed Broke the “Rate Cuts Save Crypto” Story
New Fed Chair Kevin Warsh’s June 2026 meeting was the turning point. Instead of the dovish pivot markets hoped for, the Fed abandoned forward guidance and signaled hikes — not cuts — might be next, after raising its 2026 core inflation forecast to 3.3% from 2.7%. Bitcoin dropped 2–4% within hours of the decision.
There was a brief reprieve on July 1, when Warsh told a European Central Bank forum that “inflation risks have come down,” sending Bitcoin back above $60,000. But he also called U.S. prices “too high” in the same breath and declined to preview the Fed’s next move — so traders treated it as relief, not a real pivot.
What the market is watching next
- Inflation data: June CPI report, due July 14, 2026 — seen as the pivot point for rate expectations.
- FOMC meeting, July 28–29: prediction markets put roughly a 70% probability on a hold, with the residual risk pointing toward a hike, not a cut.
- Dot plot shift: nine of 18 Fed officials now project at least one 2026 rate hike, versus a cutting bias earlier in the year.
2. The ETF Machine Went Into Reverse
Spot Bitcoin ETFs have become Bitcoin’s single biggest marginal buyer — and seller. Roughly 45% of weekly price moves are now estimated to trace back to ETF flow mechanics, since authorized participants buy or sell real Bitcoin on the spot market to match fund creation and redemption.
That mechanism worked against Bitcoin for most of late June. BlackRock’s IBIT, the dominant fund in the space, recorded 10 to 11 consecutive days of outflows totalling more than $2.2 billion, part of an eighth straight week of redemptions across the entire spot ETF complex.
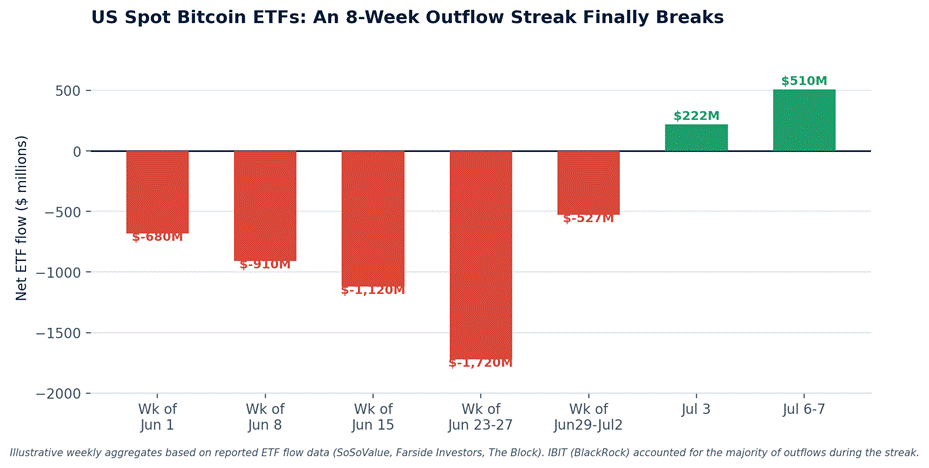
The 10-day, roughly $2.7 billion outflow streak broke on July 3 — but the recovery has been uneven.
The streak finally broke on July 3, when US spot Bitcoin ETFs pulled in $221.7 million — their best day since early May — followed by IBIT’s own $209 million inflow on July 7. Fidelity’s FBTC has actually led the rebound on several days while IBIT kept bleeding, which analysts read as rotation inside the ETF complex rather than fresh institutional conviction returning to Bitcoin outright.
| Period | Net ETF Flow | Signal |
| Week of Jun 23–27 | -$1.72B | Deepening outflows |
| Week of Jun 29–Jul 2 | -$527M (8th straight week) | Streak continues |
| Jul 3, 2026 | +$221.7M | Streak breaks |
| Jul 6–7, 2026 | +$510M (3-day total) | Tentative recovery |
3. Middle East Tensions Reopened the Inflation Question
Renewed U.S.–Iran military strikes over the weekend of July 11–13 rattled risk appetite right as Bitcoin was trying to stabilize. The bigger issue is what this does to oil: if Strait of Hormuz disruptions keep energy prices elevated, the disinflationary case for a Fed pause weakens — tightening the very screw that’s already been squeezing Bitcoin all year.
It’s a feedback loop. Geopolitical risk pushes oil higher, oil pushes inflation expectations higher, and a hawkish Fed becomes more likely to stay hawkish for longer — exactly the scenario that has kept Bitcoin capped below $64,000 since late June.
4. The Chart Broke a Multi-Year Trendline
Bitcoin closed a full week below $60,000 in late June — its first weekly close below the 200-week moving average since 2023, a line that has historically only been breached during the worst stretches of past bear markets. The $60,000 level itself used to be the floor: it held during a brutal February 2026 crash from above $80,000.
Now it’s resistance-heavy overhead that matters. The 20-day moving average sits near $62,500, with tougher resistance at $63,800 and the 50-month EMA around $65,600–$65,700 — the level analysts say Bitcoin needs to reclaim to seriously reopen the path back toward $70,000.
Read More About Crypto Assests
5. Who’s Actually Holding the Bag? Bitcoin’s Demographics in 2026
Zooming out from the daily price war, it’s worth asking who owns Bitcoin in the first place — because that shapes how this dip gets absorbed. An estimated 480–500 million people worldwide now own Bitcoin in some form, out of roughly 559 million global crypto owners overall.
Bitcoin ownership skews male and middle-aged, though both gaps are narrowing year over year.
| Segment | Share | Trend |
| Male owners | 61% | Down from ~70% a few years ago |
| Female owners | 39% | Rising, esp. among Gen Z women |
| Age 30–44 (largest bracket) | 32% | Core millennial cohort |
| Age 45–59 | 31% | Fastest-growing older bracket |
| Age 18–29 | 19% | Entry-level / newer holders |
| Age 60+ | 17% | Small but growing |
| Hold Bitcoin specifically | 74% of all crypto holders | Still #1 by far |
| Top 1% of BTC holders control | ~87% of supply | Concentration remains extreme |
The concentration point matters for this dip in particular: with roughly 70–72% of Bitcoin’s supply untouched for six months or more, most holders are structurally positioned to ride out drawdowns rather than panic-sell into them. The volatility below $64,000 is being driven disproportionately by ETF flows and short-term traders, not by the broad base of long-term holders shown above.
What Would Actually Change the Story
| Catalyst | Date | Bullish outcome | Bearish outcome |
| June CPI report | Jul 14, 2026 | Cooler print revives rate-cut hopes | Hot print (energy-driven) cements hawkish Fed |
| FOMC decision | Jul 28–29, 2026 | Hold + dovish tone | Hold + hawkish tone, or a hike |
| ETF flows | Ongoing | Multiple funds turn green together | IBIT resumes broad-based bleeding |
| Iran/Hormuz situation | Ongoing | De-escalation, oil retreats | Escalation keeps oil (and inflation) elevated |
Read More About Crypto Basic
The Bottom Line
Bitcoin below $64,000 isn’t a mystery — it’s the predictable result of a hawkish Fed, a historic ETF outflow streak, fresh geopolitical shocks, and a broken technical trendline arriving at the same time. None of these are permanent conditions. But until at least one clearly breaks in Bitcoin’s favor, the path of least resistance is sideways-to-down, coiled between a $58,000 floor and a $63,800 ceiling, waiting for the Fed to make the next move.
The market isn’t panicking — it’s waiting. And in crypto, waiting can be its own kind of volatility.Disclaimer: This article is for informational purposes only and is not investment advice. Cryptocurrency prices are highly volatile. Figures are approximate and reflect publicly reported data as of July 13, 20
 By
By



 By
By